When the barcode scanned is not coded in one of the above symbologies, then the Genspec do not apply and the choice of the scanning aperture can be made on the basis of the table below :
Comments:
3. How the ISO grading works3-1: The weakest link The ISO grading method consists of grading the print quality of a barcode from the best possible grade: 4 (or A) to the worst possible grade 0 (or F). To work out the overall grade, for each scan, a total of 7 parametres are taken into account and each graded individually. These seven parametres are: Rmin, Symbol Contrast, Minimum Edge Contrast, Modulation, Decodability, Defects and Decode. The lowest of the seven grades (the weakest link of the chain) becomes the ISO grade of the scan. Obviously, as it is recommended when verifying a given barcode to average over several scans, the overall grade is the average value of the ISO grades measured for each scan. The Axicon software calculates and displays automatically the overall scan. 3-2:
Tables
3-2-2:correspondance between alphabetic and numeric grades
Comments:
3-3: How many scans should we average on ? Tip:
Averaging is about consistency of the grading throughout the height of
the barcode. Take 3 scans of the barcode: one at the top, one in the
middle and one at the bottom. If the results are good (A or B) and
very consistent (same grade each scan) then a 3 scans average is
enough, if the result are not so good (C, D or F) and not so
consistent (1 grade difference) then go for a 5 scan average, if the
results are not consistent (results with 2 grade difference or more)
then go for a 10 scan average.
| ||||||||||||||||||||||||||||||||||||||||||||||||||||||||||||||||||||||||||||||||||||||||||||||||||||||||||||||||||||||||||||

 |
* Should you be watching at this diagram on the black and white printed version of this document, then the above will not make much sense to you. This case study is relevant only if seen on a coulour version.
Comments:
1/ Since we are aiming to achieve the lowest possible reflectance,
increasing the density of a gloss black ink could become
counter-productive. A better result might be achieved by either using
a more matt black ink, or by reducing the density of the ink if a
gloss black needs to be used.
2/ the Maximum reflectance value (RMax) is also displayed in the Detail screen, but this is not one of the ISO parametres. Rmax is the highest reflectance recorded by the scanner i.e. from the background. From an ideal white space this would be approx 90%. If the background is of a different colour e.g. on a cardboard box, this level reduces from the ideal providing a lower percentage. Although Rmax is not itself one of the ISO/ANSI parameters, it is used to calculate the symbol contrast parameter (see below).
3/ Likewise the Global Threshold (Threshold) value is displayed in the Details Screen. This is not one of the ISO/ANSI parameters either.
4-2: The SYMBOL CONTRAST Parameter
Definition:
The Symbol Contrast is the difference between the highest and the lowest reflectance values in the
profile, i.e. the difference between Rmax and Rmin. SC = Rmax -
Rmin. The maximum reflectance (Rmax) may occur anywhere, in a space or a Quiet Zone. The minimum value (Rmin) will always be in a bar.
The importance of this parameter is that the higher the Symbol Contrast, the more easily distinguishable from each other the bars and spaces will be,
so, ideally, this difference in percentage will be very high. As the
difference between the reflectance in bars and spaces falls so will
the percentage, and therefore the grade.
Potential causes
of problems:
• Background too dark. Solutions: Use lighter or less glossy material or change background colour (if printed) to one with higher reflectance
• Showthrough of contents. Solutions: Use more opaque material for package, or print opaque white underlay prior to printing symbol
• Bars too light. Solutions: Change bar colour for one with lower
reflectance.
Definition:
Please read comment in
section 2.2 on how to use the static reflectance profile to test the
likely Symbol Contrast grade of an Ink/Substrate configuration.
Case
Studies:
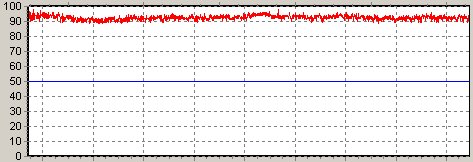
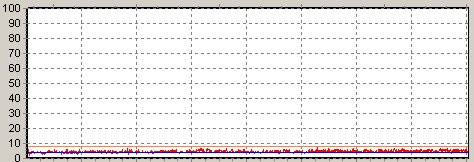
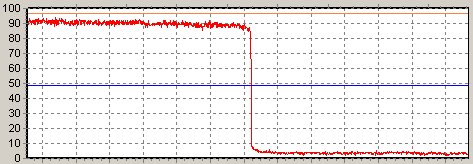
The images below show three examples of reflectance
profiles, from very good, to very bad. At the top, black bars on a
plain white background, this is ideal and the contrast is at 83% and
has a grade A. The middle barcode is typical of a dark packaging where
a layer of white has been applied to offer a light background but the
layer is too thin and its reflectance does not exceed 35%. The Symbol
Contrast at 32% is graded D. The bottom sample is just not scanable as
the background appears as brown/gold which is absolutely
inappropriate. We can just about see the shape of a barcode on the
reflectance profile, however the Rmax is at about 10% hence an
extremely poor contrast. Note that in both case studies where the
contrast is failing, the Rmin value is good, it is the Rmax value that
is at the origin of the problem, but we could obviously have a case
where the background is fine but the value of Rmin too high to ensure
a good contrast. Please click on the relevant link to download
the Scan file and open it with the Axicon Verifier software.
 |
|
|
|
|
 |
|
|
|
|
 |
|
|
|
4-3:
The MINIMUM EDGE CONTRAST Parameter
Definition:
The Edge Contrast is defined as the difference
between the highest and lowest reflectance values in a pair of adjacent elements (bar + space or space + bar). Quiet zones are considered spaces for this purpose.The
lowest difference found anywhere in the barcode is recorded as the
Minimum Edge Contrast (ECmin). This is a Pass/Fail grade. If
the minimum edge contrast is less than 15%, the verifier will give a
grade 0 (F) otherwise the grade wil be 4(A).
Potential causes
of problems:
The Minimum Edge Contrast as such is very
rarely identified as the unique failing parametre of a barcode.
However the
ECmin value is used in the calculation of the
Modulation parametre. So please refer to the Modulation parametres for
potential causes of problems as they will be closely linked.
4-4:
The MODULATION Parameter
Definition:
This parameter is related to the previous one, and is a measure of
the Minimum Edge Contrast as a proportion of the Symbol Contrast. Low Modulation values will be caused by the same factors as low Edge Contrast. The difference is that Modulation relates Edge Contrast to Symbol Contrast:
MOD = ECmin/SC. A low Edge Contrast value carries a greater risk of causing poor reading results when Symbol Contrast is high than the same Edge Contrast value has when Symbol Contrast is low.
The Modulation, is graded from A to F, with a grade F being achieved
when the Minimum Edge Contrast difference is lower than 40% of the main Symbol
Contrast. This indicates the parts of the code where the scanner is
most likely to miss a bar to space transition and therefore fail to
read.
Potential causes
of problems:
• showthrough of contents. Solutions: Use more opaque material for package, or print opaque white underlay prior to printing symbol
• local variations in background reflectance, e.g. fragments of darker material in a recycled material. Solution: use a more consistent substrate or one with higher reflectance
• local variations in inking of the bars Solution: adjust press settings to ensure even or darker inking
• element(s) adjoining the edge in question appear excessively narrow relative to the measuring aperture used. Solutions: increase X dimension; ensure correct measuring aperture is used; apply correct bar width adjustment when originating symbol; print bars marginally narrower than spaces of same modular dimension
Case Studies:
The example below is probably the most frequent case of
poor Modulation, ie the case of a barcode printed on a see through
flexible material. In the example below, we took a picture of the sample placed on top of
the printed words "Axicon Auto ID" and an image of our logo.
They both show quite well because the opacity of the
material on which the barcode is printed is very low.

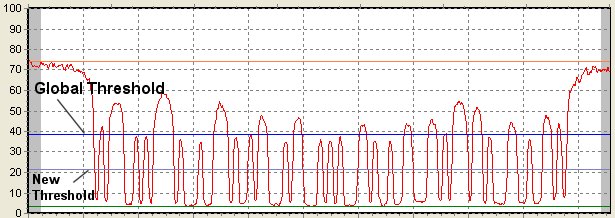
The first reflectance profile shown below demonstrates poor modulation. This example receives a score of 45% for modulation which is a grade D. The peaks of the reflectance profile represent the areas of highest reflection of incident light. The portions of the graph above the global threshold represent the spaces of the bar code. Several of the peaks hardly exceed the global threshold. The spaces need to reflect a large proportion of the incident light. In this example the substrate is translucent so much of the light travels through the areas of substrate representing the spaces without being reflected. This is worse in the narrow spaces. The solution is to make the substrate more opaque in the area where the bar code is printed, eg. by applying a "white out box". It might also help to make the bar code at a larger magnification
The second profile shows a scan of exactly the same sample but this time it has been placed over a dark background and then scanned. Naturally, the see through problem remains, but this time the whole reflectance of the barcode has gone down and the Symbol Contrast with it, which lowers the value of the global threshold but also improves the Modulation from a grade D to a grade C (55%).
Please click on the relevant link to download
the Scan file and open it with the Axicon Verifier software.
 |
|
|
|
In the reflectance profile window*, you can display the modulation values of each element. When the Modulation box is ticked as the example below shows, the modulation value is indicated along the profile in light blue. We have shown the edge ( from the 16th bar to the 16th space in the barcode) that gets the lowest value for modulation.
*As of version 2.0.20.1 of the Axicon
verifier software (click
here to access the download page)
4-5:
The DEFECT Parameter
Definition:
Defects in the code could be unwanted
small ink spots or smudges in the quiet zones or spaces, small holes
in what should be a solid bar (where ink simply has not taken to the
paper), or a very narrow vertical line in a bar, such as can occur
when a single element of the print head of a thermal printer has
failed. All these will cause non uniformity in the scan reflectance profile at the point where the scan path crosses them. This is referred to in the profile analysis as Element Reflectance Non-uniformity
(ERN).
A spot of ink in a space would show a sudden dip in the reflectance
profile where only a peak is expected. Defects in a bar, show as a peak. If this peak or
dip approaches the Global Threshold, the risk of the defect being seen as
an actual element and thus of the scan failing to decode, increases. As already indicated, the use of the correct measuring aperture ensures that the effect of defects is not exaggerated or underrated. The defect parameter measures the relationship of the depth of the highest peak or deepest
dip to Symbol Contrast (Defects = ERNmax/SC)
Potential causes
of problems:
• defective substrate (Highly recycled cardboard)
• defective print head elements (thermal printing or ink jet printing) which will tend to produce an unprinted line running through the symbol in the direction of printing. Solution: clean or replace print head
• satellite ink droplets (ink jet printing). Solution: clean head, change ink formulation
• haloing (flexography). Solution: adjust impression pressure and/or ink viscosity
• incorrect matching of thermal transfer ribbons and substrate (poor adhesion of ink to surface). Solution: use correct ribbon for substrate, use smoother substrate
• measuring aperture too small. Solution: use verifier with correct aperture, e.g., 0.15 mm (6 mills) for EAN/UPC symbols
• Defects can also be located in the quiet zones, particularly when the
margin is too short, but the colour of the substrate outside the
margin is still light enough to create a difference in the reflectance
but not big enough to go below the global threshold and thus be
treated as a defect and not a quiet zone violation. See example below.
Case Studies:
In the first example, the sample is a barcode printed on corrugated cardboard. The cardboard itself is full of smudges and defects, also the ink has splattered or has been unevenly layed creating some light zones in the bars and dark ones in the spaces. The image is a close up of the barcode. The reflectance profile shows many ERN (Element Reflectance Non uniformity), the ERN max is identified on the left hand side of the profile, its height is roughly 23% which reported to the 82% Symbol Contrast gives us a 28% defect, hence a D grade.
The second reflectance profile is a case where the defect is found in the left light margin. Surely this is because the light margin was too short, but the change of colour in the background is not large enough to create a margin violation. This is still classified as a defect.
 |
|
|
|
|
 |
In the reflectance profile window*, you have the option to spot the worst defect for each element. When the Defect box is ticked as the example below shows, a histogram identifies along the profile the value of the highest defect found for each element. When the defect proves to be so high that the resulting grade is below the minimum pass grade, the tower is coloured in red, otherwise the towers are coloured in green. Here there is a substantial defect within the 17th space from the left of the barcode.
*As of version 2.0.20.1 of the Axicon
verifier software (click
here to access the download page)
4-6:
The DECODABILITY Parameter
Definition:
Although a fairly easy concept in principle, Decodability is harder to explain in a few words. Decodability relates to how easily a decoder can determine what the characters in a barcode are, taking into account the individual bar and space deviation from the ideal dimensions. Poor decodability grades are always a result of poor dimensional accuracy.
However, it only applies to those measurements needed by the decode algorithm to determine the width of an element, or the combined widths of elements, in order to decode the symbol character. Taking a simple case, if it is a question of determining a particular width, the decode algorithm might say something like "If the measurement is between 2.5 modules and 3.5 modules, treat it as equal to three modules." In other words, 2.5 modules is the threshold value between two modules and three modules, and 3.5 modules is the upper threshold between three and four modules; there is a 0.5 module margin on either side of the nominal measurement of 3.0. Decodability measures how much of this margin is left in the worst (most deviating) measurement: assume the measurement is 2.7 modules, then only 0.2 is left between the actual measurement and the 2.5 threshold, out of the total margin of 0.5, so the Decodability value is 0.2/0.5, which is 40%. The lower the Decodability, the harder it will be for a decoder to decode the symbol. Some symbologies have particular features which require a more complex Decodability calculation.
If low grades are achieved it may not be immediately obvious what the fault is or where it may lie. However, if a low grade is achieved for decodability, the first item to check is the figure for the average bar gain. If it is close to or outside the allowed tolerance this will almost certainly cause poor Decodability.
Even if the average bar gain is well within the tolerance level, it could still be affecting the decodability, as it is possible that bar gain is only happening on one side of the code. This could occur if more pressure is being placed on one part of the print head/print plate than the other and should be adjusted accordingly, either by evening pressure or by changing the orientation of the code.
Check the other parameters to see if any other grades are also poor. In particular, poor Modulation can have a large effect on the measured dimensions of bars and spaces, and therefore on Decodability. If all other grades are good, it may simply be that the origination of some of the individual bar and space dimensions is not ideal; e.g. if the resolution of your printer is not adequate for that size of barcode.
Potential causes
of problems:
• Bar width gain/loss (systematic). Solutions: Apply correct bar width adjustment when originating symbol; adjust press settings.
• Element width gain/loss (non-systematic). Solutions: Correct missing pixels (burnt-out print head elements, blocked ink-jet nozzles); rectify cause of defects.
• Distortion of symbol (uneven stretching of flexographic plate; non-linear disproportioning in plate-making process). Solutions: Print symbol with height of bars parallel to direction of printing; do not disproportion bar code image in plate-making.
• Rescaling of digitally originated images. Solutions: Ensure symbol is created in correct size; ensure software matches module widths to integer number of pixels after all adjustments.
• Irregular element edges (ink-jet, photogravure, screen process printing). Solutions: Change print technology; increase X dimension/magnification factor; re-orientate symbol relative to cylinder engraving angle/screen mesh.
Comments:
1/ The Dimensional Analysis window
More details of how the decodability grade is made up are available from the Dimensional Analysis Window. Indeed this window gives all the details of the elements decodability calculation, an histogram diagram represents the elements individual decodability value (the worst one is then chosen as the scan decodability value to work out the grade), with a colour coding (green when above standard, red when below standard), and the elements width calculations for all elements of the barcode, as per the symbology decode algorithm. See an exemple of the Dimensional Analysis Window of an EAN-13 barcode below. In the representation of the barcode, the blue area represents the element with the worst decodability value.
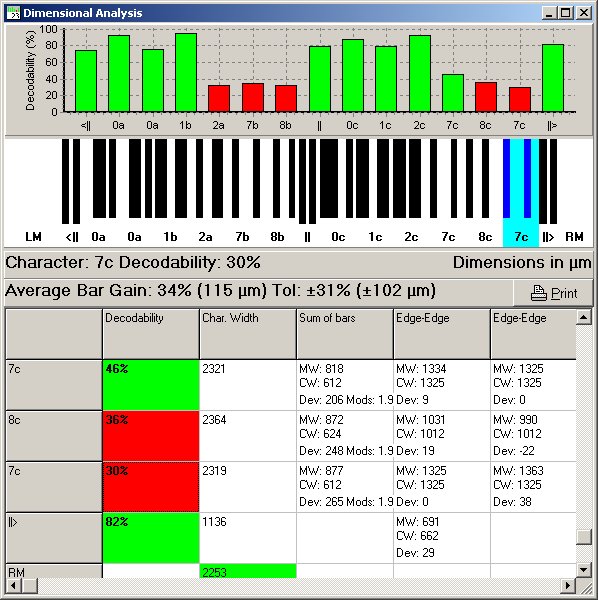
The bottom pane of the dimensional analysis window shows the element
deviations for each character, as used to calculate the decodability.
Clicking in this pane will highlight the associated bars in the
graphical display of the code. You can also step through the
characters using the up and down-arrow keys.
The leftmost column always displays the decoded character, and the
next column shows the decodability of that character. This field is
coloured according to whether the decodability falls below the pass
grade.
The contents of the remaining columns depend on the symbology of the
bar code. There will be a column for each of the measurements used in
calculating the decodability. The possible column headings and their
meanings are:
For each measurement, three values are displayed:
MW: The width measured from the actual bars and spaces of the
code
CW: The Calculated (perfect) width
Dev: The deviation of the measured from the calculated width
The dimensions in the table will be displayed in either microns or
ten-thousandths of an inch (depending on the measurement units chosen
in the Setup configuration).
2/ For an EAN/UPC barcode (as in the example of an EAN-13 barcode
above) the edge to edge calculations are shown in the diagram below,
where e1 and e2 represent the values taken into consideration to
decode the barcode, as well as b1+b2 for some characters. S is the
width of the character.
3/ There is a very specific case which can occur with EAN/UPC barcodes, where the conjunction of having excessive ink spread + the presence of the characters 1, 2, 7 or 8 in the code = poor decodability of these characters. Litterally, the decodability of these characters is a lot more sensitive to a high ink spread or ink reduction. The same problem will not affect other sets of characters in the barcode but will give a poor decodability grade on these specific characters.
Excessive
positive bar gain (ink spread) will affect the decodability of
characters: 1a, 2a, 7b, 7c, 8b, 8c
Excessive negative bar gain (ink reduction) will affect the
decodability of characters: 1b, 1c, 2b, 2c, 7a, 8a
Please note that this is only true for EAN/UPC barcodes (EAN-8,
EAN-13, UPC-E, UPC-A).
Case
Studies:
The barcode below presents a very important bar gain due to excessive
ink spread (43%) however its decodability is graded A. The second
sample has also substantial ink spread (30%) but there, due to the
presence of the characters 2a, 7b, 8b, 7c and 8c, that are so
sensitive to ink spread, the decodability is very poor and gets a
grade D. SO depending on the structure of the barcode, the same
quality problem (major ink spread) will have different effects
(Pass/Fail).
|
|
|
|
|
|
|
|
|
|
4-7: The DECODE Parameter
Definition:
The first step in analysing the profile, after identifying the bar and space regions in the profile and determining the position of each element edge, is to apply the reference decode algorithm - the set of rules/steps for decoding a symbol defined in the symbology specification - to the elements "seen" in the scan reflectance profile. If a valid decode results, the decode parameter passes and is given grade 4, otherwise it fails (grade 0). If the wrong number of elements is seen, the decode clearly fails. Note that in the ANSI standards this last case is graded separately as an "edge determination" failure, although the final effect on the profile grade is the same.
It also applies other checks to ensure that the bar code does not break any other rules laid down for codes of that symbology, including:
- Light margin checking
- Check digits (where they are mandatory)
- Structure of the code (correct start/stop characters etc.)
This results in a decode grade of either 4 (A) or 0 (F). If a code is assigned a decode grade of 0, the "Scan" tab, at the top of the Details window will describe in more detail the reason for the failure.
Potential causes
of problems:
• Symbol incorrectly encoded. Solutions: Re-originate symbol; over-label with correctly encoded symbol
• Check digit incorrectly calculated. Solutions: Correct software error in origination system; re-originate symbol; over-label with correctly calculated symbol
• Light margin infringement. Solutions: Ensure enough room is left on both
sides of the code to guarantee the non violation of the margins.
• Too many elements detected due to defects. Solutions: Correct cause of defects; adjust press (relief printing processes) to reduce haloing; replace print head (thermal/ink-jet printing)
• Too few elements detected (failure to cross Global Threshold). Solutions: (as for Edge Contrast)
• Negative barcode, where a light colour is used for the bars printed on
a dark background. Solutions, change bar and background colours.
Comments
1/ The ‘Encodation’ tab of the Detail Window displays the full encoded number including start and stop characters, subset information, and other non-data characters. This can be useful when producing EAN/UCC-128, as it allows you to check which subset the barcode has been produced in.
2/ When the decode grade is an F, then the ‘Scan’ tab displays the reason for failing the Decode grade. In the 3rd case study below, the reason for failing the grade is: "Decode algorithm failed".
Case Studies:
1/This barcode gets an F grade for
Decode. On a 10 scan average 8 scans were found with a violation
of the light margin on the right of the barcode. This can really
affect readability of the barcode.
|
|

2/ On the example below, the barcode is
not scannable at all, indeed there is a bar missing, so the
decode algorithm wil fail automatically.

3/ This next case is an example of a barcode where the decode algorithm fails because as we see on the reflectance profile below, many peaks do not reach over the global threshold.
5. The remaining Axicon Verifier software windows
In the previous chapters, we have introduced the "Summary", the "Reflectance Profile", the "Details" and the "Decodability" windows, which are the main sources of information to understand the verification results. But it is also important that we now review the remaining four display windows of the verifier. The "Command", the "Pass/Fail", the 'Traditional Analysis" windows and finally the "Set up" windows.
5-1: The COMMAND window
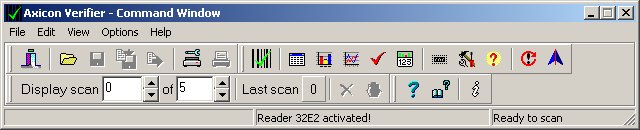
The Command window contains pull-down menus and toolbar buttons to access all of the features of the verifier. Almost all the features are available from both the menus and the buttons, and many are also accessible from the keyboard.
5.1.1 The "File" menu
- Load
- Reloads data previously saved with 'Save Data' from hard or floppy disk. Note: when loading the data, you do not need to have the same model or type of verifier connected as when the scan was saved.
- Save
- Saves all the details of the current
scan to an 'Axicon Verifier Saved Scan' (.scn) file. This allows
you to
- investigate the detail of each scan at a later time
- keep a complete record of verification results
- send saved scans by email or floppy disk for assistance with interpretation of the results. Axicon and most Axicon distributors offer this as a chargeable service.
Also, unlike the storage of results in text or CSV files, saved information is less susceptible to tampering, making this a more reliable source of data. - Save Text
- Saves the results as text files to the directory of your choice. On clicking the 'Save Text' button you will be asked to name the file and where you want to store it. Results are saved as standard text files and can be opened and printed using any Windows word processor or Windows Notepad/Wordpad
- Write to CSV
- Appends the results in CSV format to
the file specified in the Setup dialog - Logging tab - CSV file
filename. Results saved to CSV text files can be viewed and/or
printed using any spreadsheet package. Please note that to use
this option you should have ticked the box next to the 'CSV
Export' line at time of installation, where you will have been
prompted to enter your password (found in the front of your manual
under the heading 'Text/CSV file'). If you did not do this then
you can enter the password now by clicking the 'Write CSV' button.
You can automatically save your results to the CSV file by entering the Setup dialog, and clicking on 'Enable Auto Save' under the CSV option on the Logging tab. The verifier will then save the results of every set of scans to the chosen CSV file. (PC-x010/PC-x015 only)
- Printer Setup
- This button allows you to define printer options and paper size. The Axicon PC Verifier can use any Windows printer, dot-matrix, ink-jet, laser, thermal transfer etc. Having verified a barcode, you can print out the verification results by clicking the "Print" button.
- Once you have collected your
results, you can click on this button to print a verification
report on any Windows printer. The report will be automatically
scaled to the available paper size.
The Axicon PC Verifier can use any printer for which a Windows printer driver is available (including thermal, thermal transfer, etc.), thus allowing you to output verification reports directly onto self-adhesive label stock for applying to the product or the paperwork.
You can configure options relating to printing with the "Printing" tab of the Setup dialog.
- Exit
- Closes all windows and exits from the verifier program
5.1.2 The "Edit" menu
- Last Scan
- Shows the number of the last scan taken.
- Delete
- Deletes the current scan data. Useful for removing bad or misread scans.
- Clear
- Clears all data from the current set
of scans, and sets the verifier ready to check the next code.
- Previous Scan
- Shows the number of the last scan taken.
- Next Scan
- Shows the number of the last scan taken.
5.1.3 The "View" menu
- Click here to perform the user
calibration.
- Reset Reader
- Resets hardware. Click on this button when changing between verifiers whilst leaving the program loaded. It is also recommended that you try this if you do not receive a response from the hardware when verifying a code.
- Show reader Info
- Displays the Reader Info dialog, which shows information about the reader currently in use, such as the firmware version or the date of the last calibration and allows you to choose between the readers connected to your computer.
- Setup Screen
- Displays the setup screen
5.1.1 The "Help" menu
Summary
Displays the Summary
Window.
Details Displays the CEN/ANSI
details window.
Reflectance Profile Displays the Scan
Reflectance Profile graph.
Pass/Fail Displays the Pass/Fail
window.
Dimensional analysis Displays the dimensional analysis Screen
Traditional Analysis: Displays the traditional Analysis
results
Save Positions: This option allows you to save the positions
of all displayed screens so that every time you start the software
they are displayed as they were when you saved. By default only the
Command and the Summary screens are automatically displayed when you
start the programme.
5.1.4 The "Option" menu
Used to calibrate the hardware. See Calibrating the Hardware.Calibrate
- Contents
- Shows a list of contents for the help files.
- Search for Help on...
- Type in your desired word to search the help files for relevant topics.
- About...
- Displays information about the software, including the version number.
Comments:
1/ The summary screen also displays, at the bottom, the serial number
of the verifier that is currently active. If no reader has been
detected, then " 0 reader found" will be displayed instead.
5-2: The PASS/FAIL window
To display the Pass/Fail Window, select "Pass/Fail" from the "View" menu in the Command Window.
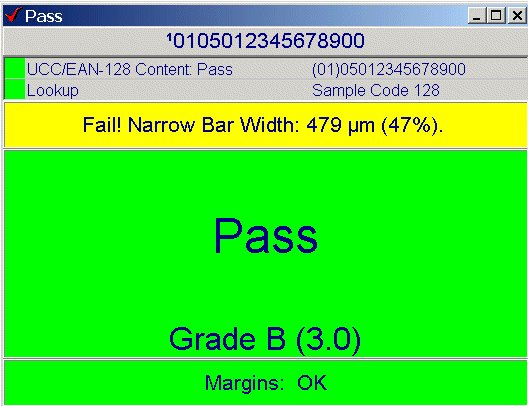
The Pass/Fail window displays a simple indication of whether your code has passed or failed certain verification criteria. The information displayed is very limited but can be favoured in cases where the operator is not supposed to carry any interpretation of the results other than checking if the barcode has passed or failed the verification. This window contains several panes, each of which shows a red, orange or green background indicating a simple pass or fail.
-
The uppermost pane shows the decoded number. Next, the results of all the Data Content Analysis plugins are listed
-
The next pane indicates if there is a problem with the bar code that is not directly included in the CEN/ANSI/ISO grade calculation, including:
Data Content
Magnification
Wide/Narrow Ratio
Print Gain
This pane will only become visible if there is a problem with one or more of these factors.
-
The central pane displays the grade achieved by the code, along with the required pass grade. The required pass grade is set from the General tab of the Setup dialog. If the "Apply EAN/UCC Gen. Spec" setting is ticked, the pass grade chosen will be that specified in the general EAN/UCC specifications for retail codes where applicable. Otherwise, the "Lowest Pass" value is used.
-
Below this, the "Margins" pane indicates if there is a light margin infringement in any of the scans currently averaged. If there is, it will show an error, and indicate the scan number(s) causing the problem, and whether the infringement is of the left or right margin.
5-3: The TRADITIONAL ANALYSIS window
To display the traditional verification results, select "Traditional Analysis" from the "View" menu in the Command Window.
The "Traditional" method of verification has now largely been superseded by the ISO/ANSI methods, which look at the code in an entirely different way and incorporate many more parameters, to account more for the actual way a reader scans a barcode and emphasise the scanability of a barcode than its sheer print quality.
However, because “traditional” verification measures factors like average bar width deviation, which can provide a valuable indicator of ink-spread, the Axicon Verifier software offers both Traditional and ISO/ANSI verification results.
The "Traditional Analysis" window contains three
panes.
-
The uppermost pane displays a series of "lamps" to indicate any bar growth or loss.
Left red = Too narrow (out of specification)
Left amber = Too narrow (warning)
Green = Good (within specification)
Right amber = Too wide (warning)
Right red = Too wide (out of specification)
-
The middle pane displays several pieces of information. It will show "Pass" and the pass colour if all traditional parameters are within the allowed range; otherwise, it will show "Fail" and the fail colour, along with an indication of the reason for failure. It also displays the Print Contrast Signal (PCS), both as an average of all scans and of the current scan only. Finally, it shows the average bar gain, both as a percentage of the narrow bar width and (if available) as an absolute amount.
-
The bottom-most pane displays the deviations of the dimensions of individual bars and spaces in the code from their nominal values.
5-4: The SETUP windows
To display the Setup dialog, choose "Setup" from the "Options" menu of the command window, or click the Setup button in the command window, or press the 'F5' key.
The Setup dialog contains seven tabs as follows:
5.4.1: General
Allows you to select the following options:
Standards
Whether results are displayed using the CEN or ANSI grading system.
If CEN is selected, grades will be displayed from a low of 0 to a high of 4. If ANSI is selected, grades will be displayed from a low of F to a high of A, with the CEN grade in brackets. For more information on CEN/ANSI standards, see Interpretation of Results.
Pass Grade.
Apply GS1 Gen. Spec./ Lowest Pass for other codes.
If you are verifying codes for use in the retail supply chain, this box should always be left ticked. It sets the verifier to conform to the
GS1 General Specification for EAN.UPC, ITF-14 and EAN-128 bar codes. In particular, it overrides the 'Lowest
Pass' 'Verify ITF Check Digit' and some other settings.
Apply lowest Pass Grade to
GenSpec
This option is for users that want to apply a more stringent lowest
pass grade than the one specified in the Genspec. This is only
relevant to GS1 symbologies though. The new pass grade is to be set in
the Pass Grade box above.
Lowest Pass (Other Codes)
Enter your lowest acceptable pass grade for non-retail codes. Under the ANSI, CEN and ISO methods of verification there is no such thing as a pass or fail grade - simply a quality assessment grade from 4 (A) to 0 (F). You should check with your customer for their specific grade requirements.
EAN/UPC magnification factor
This is reserved for users of our PC5000 series. Measure your bar code using the scale rule provided and enter the magnification factor here. The box labelled ‘Ask every scan’ should be automatically ticked. Untick if you know all your codes have the same magnification factor e.g. 100%.
Units
When this is set to 'Default', the verifier will display its results using the measurement units currently selected in the Windows Regional Settings control panel. The other two settings of this control will over-ride the Windows setting.
5.4.2 Check Characters
Allows you to select the following options:
ITF check digit checking (Modulo-10)
Code 39 check character checking (Modulo-43)
Codabar check character checking (Modulo-16)
Note: EAN/UPC, ITF-14, wCode 128 and UPC/EAN128, RSS, MSI Plessey (modulo-10) and Code 93 symbol check digits are always verified, as they are a mandatory part of the barcode.
5.4.3 Appearance
Allows you to change the colours used to denote codes which have passed or failed your chosen pass grade. Click on the appropriate box, and select a colour.
You also have the option of adding an audible warning for passing and failing codes. Click the approriate button and select any ‘.wav’ file.
The warning colour and sound are used when the overall grade is within 0.5 of the pass grade. In this case, it is likely that at least one scan of a set of scans being averaged has fallen below the pass grade.
"Custom Pass/Fail Display" is only of use if you have to follow Target Retail Stores quality control procedures, which require the three panes of the "Pass/Fail" window to appear in a different order.
5.4.4 Printing
Print Command
This setting allows you to choose what is printed when the 'Print' command is chosen from the Command window
Report Options
'Auto Print' will cause the software to automatically print out a verification report on completing the set number of scans for each barcode. Auto Print will automatically send the data to the Windows default printer, and not ask you to select a printer. You should ensure that the default printer is available when using this feature.
'Use Smaller Font' will cause verification reports to be printed using a smaller font. This may be useful if fields on the printout are over-running the space allotted to them.
'Print Header' is the text which appears at the top of the printed report. To revert to the default text, clear this field.
Graph Options
Check ‘Print graph in black and white’ if the Static Reflectance Profile graph does not print correctly on a monochrome printer. There is a bug in the printer driver for the HP LaserJet III under Windows NT which can cause problems printing coloured items, and this setting may improve print quality on other monochrome printers too.
5.4.5 Logging
Allows you to select the following options;
Auto Save Data
If enabled, every scan will automatically be saved to a file in the specified directory. The default directory is the 'Saved Scans' sub-folder of <My Documents>. If you enable Auto Save Data, but the directory chosen does not exist, you will be asked if you want to create it.
Auto-saved files can be re-opened with 'Load data' from the Command window, or
by using the 'Scan File Data Extractor'. Filenames of auto-saved data files are eight characters long, and made up of the characters '0' to '9' and 'a' to 'f'.
For more information on file storage, please see "File Storage and Printing".
Saved File Log
This allows you to run any Windows program each time a file is saved. It is intended for use with the 'Scan File Data Extractor', but could be used to perform any action on the saved file. The command in 'Log Command' will be executed each time a scan is automatically or manually saved (according to the settings of 'Log Auto Saved/Manually Saved Files), with command-line parameters as given in 'Log Parameters' ('%s' stands for the full path and name of the saved scan file).
CSV File
‘Auto Save’ (PC-x010/x015 only)
Allows a subset of the scan information to be automatically appended to the specified file in CSV format. This feature is of limited use; we would recommend installing the 'Scan File Data Extractor' instead
‘Save Path’
If ticked, stores the complete path and file name of the auto-saved data file into the CSV file, otherwise only the file name itself is saved.
5.4.6. Calibration
Allows you to select the following options;
Calibration file
Specifies the file and directory in which calibration data will be saved. This can be altered by clicking on the browse button and choosing the required directory and filename.
Calibration Expiry
Checks that the verifier was last calibrated within the time period you specify, and displays a warning dialog if it has not. If "Allow scans after calibration has expired" is not ticked, no scans will be allowed until the verifier has been re-calibrated.
Password
If the "Require Setup Password for calibration" box is ticked, when you click "OK" in the Calibration dialog, you will be required to enter the Setup password, which is set from the Advanced tab of the Setup dialog.
Allowed Calibration Codes
This is a list of the data content of bar codes with which calibration is permitted. The default values match the codes on the "Axicon PC Verifier Calibration Sheet". You can permit any bar code to be used as a calibration code by unticking "Enforce".
5.4.7. Plugins
Allows you to configure plugin data content options where necessary. Results from plugins are displayed as a tab in the Summary window when an appropriate code is scanned.
See the section Standard Plugins for a list of the plugin features that are installed as standard.
To enable a plugin, make sure the box next to its name is ticked. To disable a plugin, untick the box. When a plugin is first installed, it will automatically be enabled.
To configure a plugin, select it in the list to the left and click the 'Configure' button. If the selected plugin has no configurable features, the button will be disabled.
Supplied plugins that have configurable options are:
Jobref: Allows you to configure the job reference, which will give you the option of entering a default job reference, and will also ask if you want to be prompted to enter a job reference after every scan.
Lookup: More information on configuring Product Look-up can be found in the Product Lookup section.
If the selected plugin is password-protected, you can enter the password for the current reader by pressing the "Password" button. This button is disabled for non-protected plugins. As standard, EAN-128 and Product Lookup require entry of a password.
5.4.8 Advanced
Allows you to select the following options;
Action following a non-decode of a scan.
Password protection of Setup settings - this is useful for ensuring features such as the Pass/Fail grade and file saving directories can only be altered by an authorised user. To apply a setup password, enter it in the "Password for Setup" box and click "OK". You will be asked to re-enter the password you gave. Now, to alter the settings you must enter the same password into the "Password for Setup" again before you click OK.
DISCLAIMER
This document is intended as a recommendation of work practices sponsored by Axicon Auto ID Ltd. Whilst this document is believed to contain correct information, neither Axicon Auto ID Ltd nor any of it’s associated companies, nor any of it’s employees, make any warranty, express or implied, or assume any legal responsibility for the accuracy, completeness or usefulness of such information that its use would not infringe privately owned rights. Reference herein to any specific commercial product, process, or service by its trade name, trademark, manufacturer or otherwise, does not necessarily constitute nor imply Axicon Auto ID Ltd endorsement nor recommendation. The views and opinions of authors expressed herein do not necessarily state or reflect those of Axicon Auto ID Ltd.